 HabitLoop
Reading your progress: score, streaks, heatmap and insights
A guide to HabitLoop's statistics: the habit score, streaks, the one-year heatmap, the Stats tab and the Insights computed on your phone.
A streak is the simplest number in habit tracking and the most fragile: one missed day and it drops to zero, even if you've done the habit 80 times this year. HabitLoop shows streaks, but it leans on a few other views that are more forgiving and more informative. This guide walks through what each one means and where to find it.
The habit score
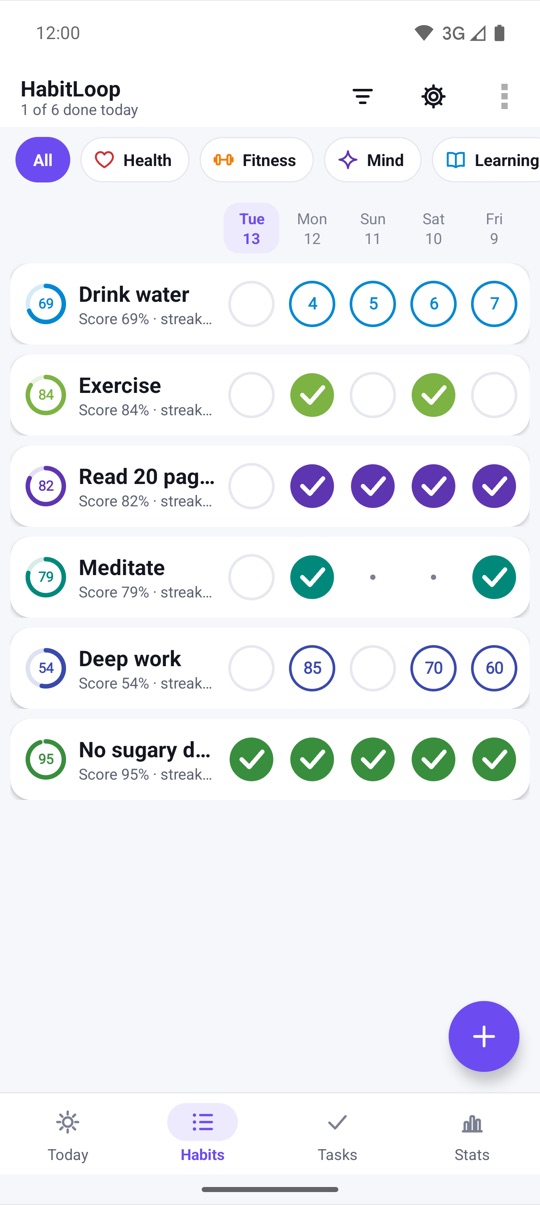
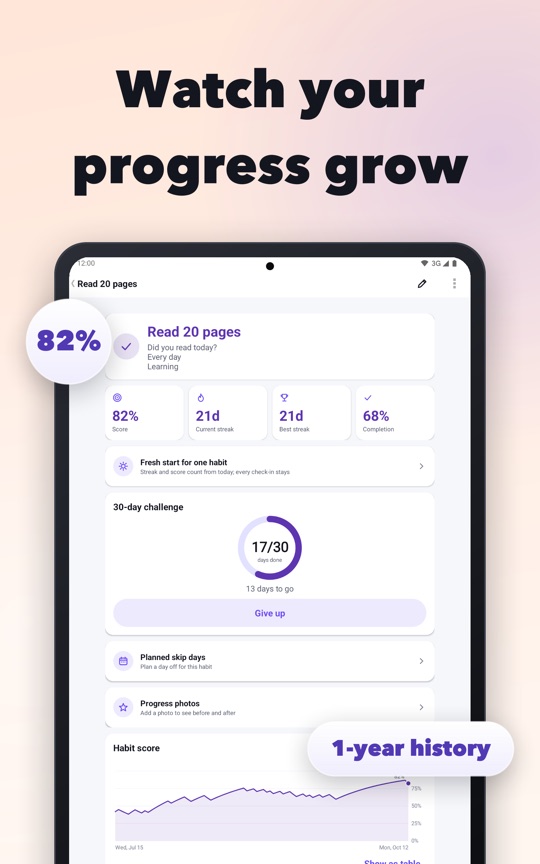
Every habit has a score from 0 to 100 percent, shown as a small ring on the Habits list and as a tile on the habit's detail screen. It works like an exponentially smoothed average of your recent days:
- each day you do the habit pulls the score up a little
- each due day you miss pulls it down a little
- days that aren't due, planned skip days and vacations leave it unchanged
The result rewards consistency over perfection. Miss one day after a good month and the score dips slightly, then recovers as you carry on. Miss two weeks and it falls noticeably. That matches how habits actually feel, much better than a streak resetting to zero.
Streaks and completion
Next to the score, the detail screen shows:
- Current streak and Best streak, which pass over planned skip days and vacations
- Completion: the share of due days you actually did
For a "quit a bad habit" goal, everything is inverted: the streak counts days clean, the score rises while you stay clean, and a relapse shows as a red cross on the heatmap.
The year heatmap, monthly bars and calendar
Scroll down on a habit's detail screen and you'll find:
- History: a one-year heatmap, one square per day, in shades of the habit's own colour. The more you did, the darker the square.
- Days done per month: columns for each month, so seasonal patterns jump out.
- Calendar: tap any day to fix a check-in you forgot, or to add a note for that day.
The Stats tab
The Stats tab looks across all your habits at once. A range row at the top (7D, 30D, 90D, 1Y, All) scopes every chart on the screen. Below it you'll find:
- Today: how many habits you've done so far
- Tiles for completion, check-ins and focus minutes, each with the change versus the previous period
- Completion rate per day, plus breakdowns by weekday and by time of day, so you can see whether mornings or evenings work better for you
- Focus minutes by habit, if you use the focus timer
Every chart has a Show as table toggle, and screen readers get a short text summary of each chart (for example, trending up, lowest and highest values).
Insights, computed on your phone
Stats > Insights goes a step further. Everything here is computed on the device; nothing is sent anywhere.
- Mood: if you use the daily mood check-in, a 14-day mood chart and simple patterns such as "On days you Walk, mood +0.6". A pattern is only shown when there are at least 4 mood days on each side and a meaningful difference.
- Keystone habits: after at least 14 shared days, pairs of habits whose completion tends to move together.
- Top obstacles: if you tag what got in the way on missed days, the most common reasons.
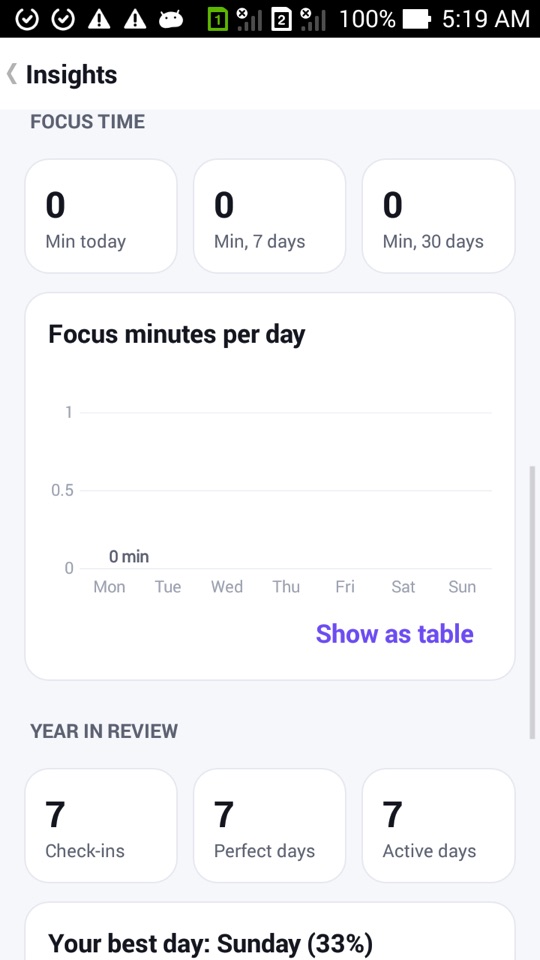
- Year in review: the last 365 days of check-ins, perfect days, active days, your best weekday, check-ins by time of day and your longest streaks.
A note of caution: these are correlations in your own data, not proof that one thing causes another. They're prompts for reflection, not conclusions.
How to review a month of progress
- Open the Stats tab and tap 30D in the range row.
- Look at the completion tile and its change versus the previous 30 days.
- Scroll to the weekday and time-of-day charts to find your strongest and weakest slots.
- Open Insights for mood patterns, keystone habits and top obstacles.
- Go to the Habits tab, tap a habit with a low score, and check its heatmap and calendar for gaps.
- Adjust that habit: change its schedule, add an If-then plan, or make it smaller.
HabitLoop's statistics and mood insights describe patterns in your own entries. They are not medical, psychological or nutritional advice. If you're concerned about your mood or health, talk to a qualified professional.
FAQ
Why did my score drop only a little after a missed day?
The score is a smoothed average, so one day moves it only slightly. It's designed to reward long-term consistency rather than punish single misses.
Do vacations and skip days lower my score?
No. Paused days are neither due nor missed. The score is held, not lowered, and streaks pass over them.
Can I fix a day I forgot to check in?
Yes. Open the habit, scroll to the calendar and tap the day to change it or add a note.
Can I hide streaks and scores entirely?
Yes. Turn on Gentle mode in Settings. Habits then show how often you showed up instead of streak numbers and scores.